Ho una domanda

Hai una domanda? Puoi esplorare la nostra pagina di supporto o inviarci un messaggio utilizzando il modulo sottostante.

Grazie! La tua richiesta è stata ricevuta!
Ops! Qualcosa è andato storto durante l'invio del modulo.

MEXEM Meets TradingView

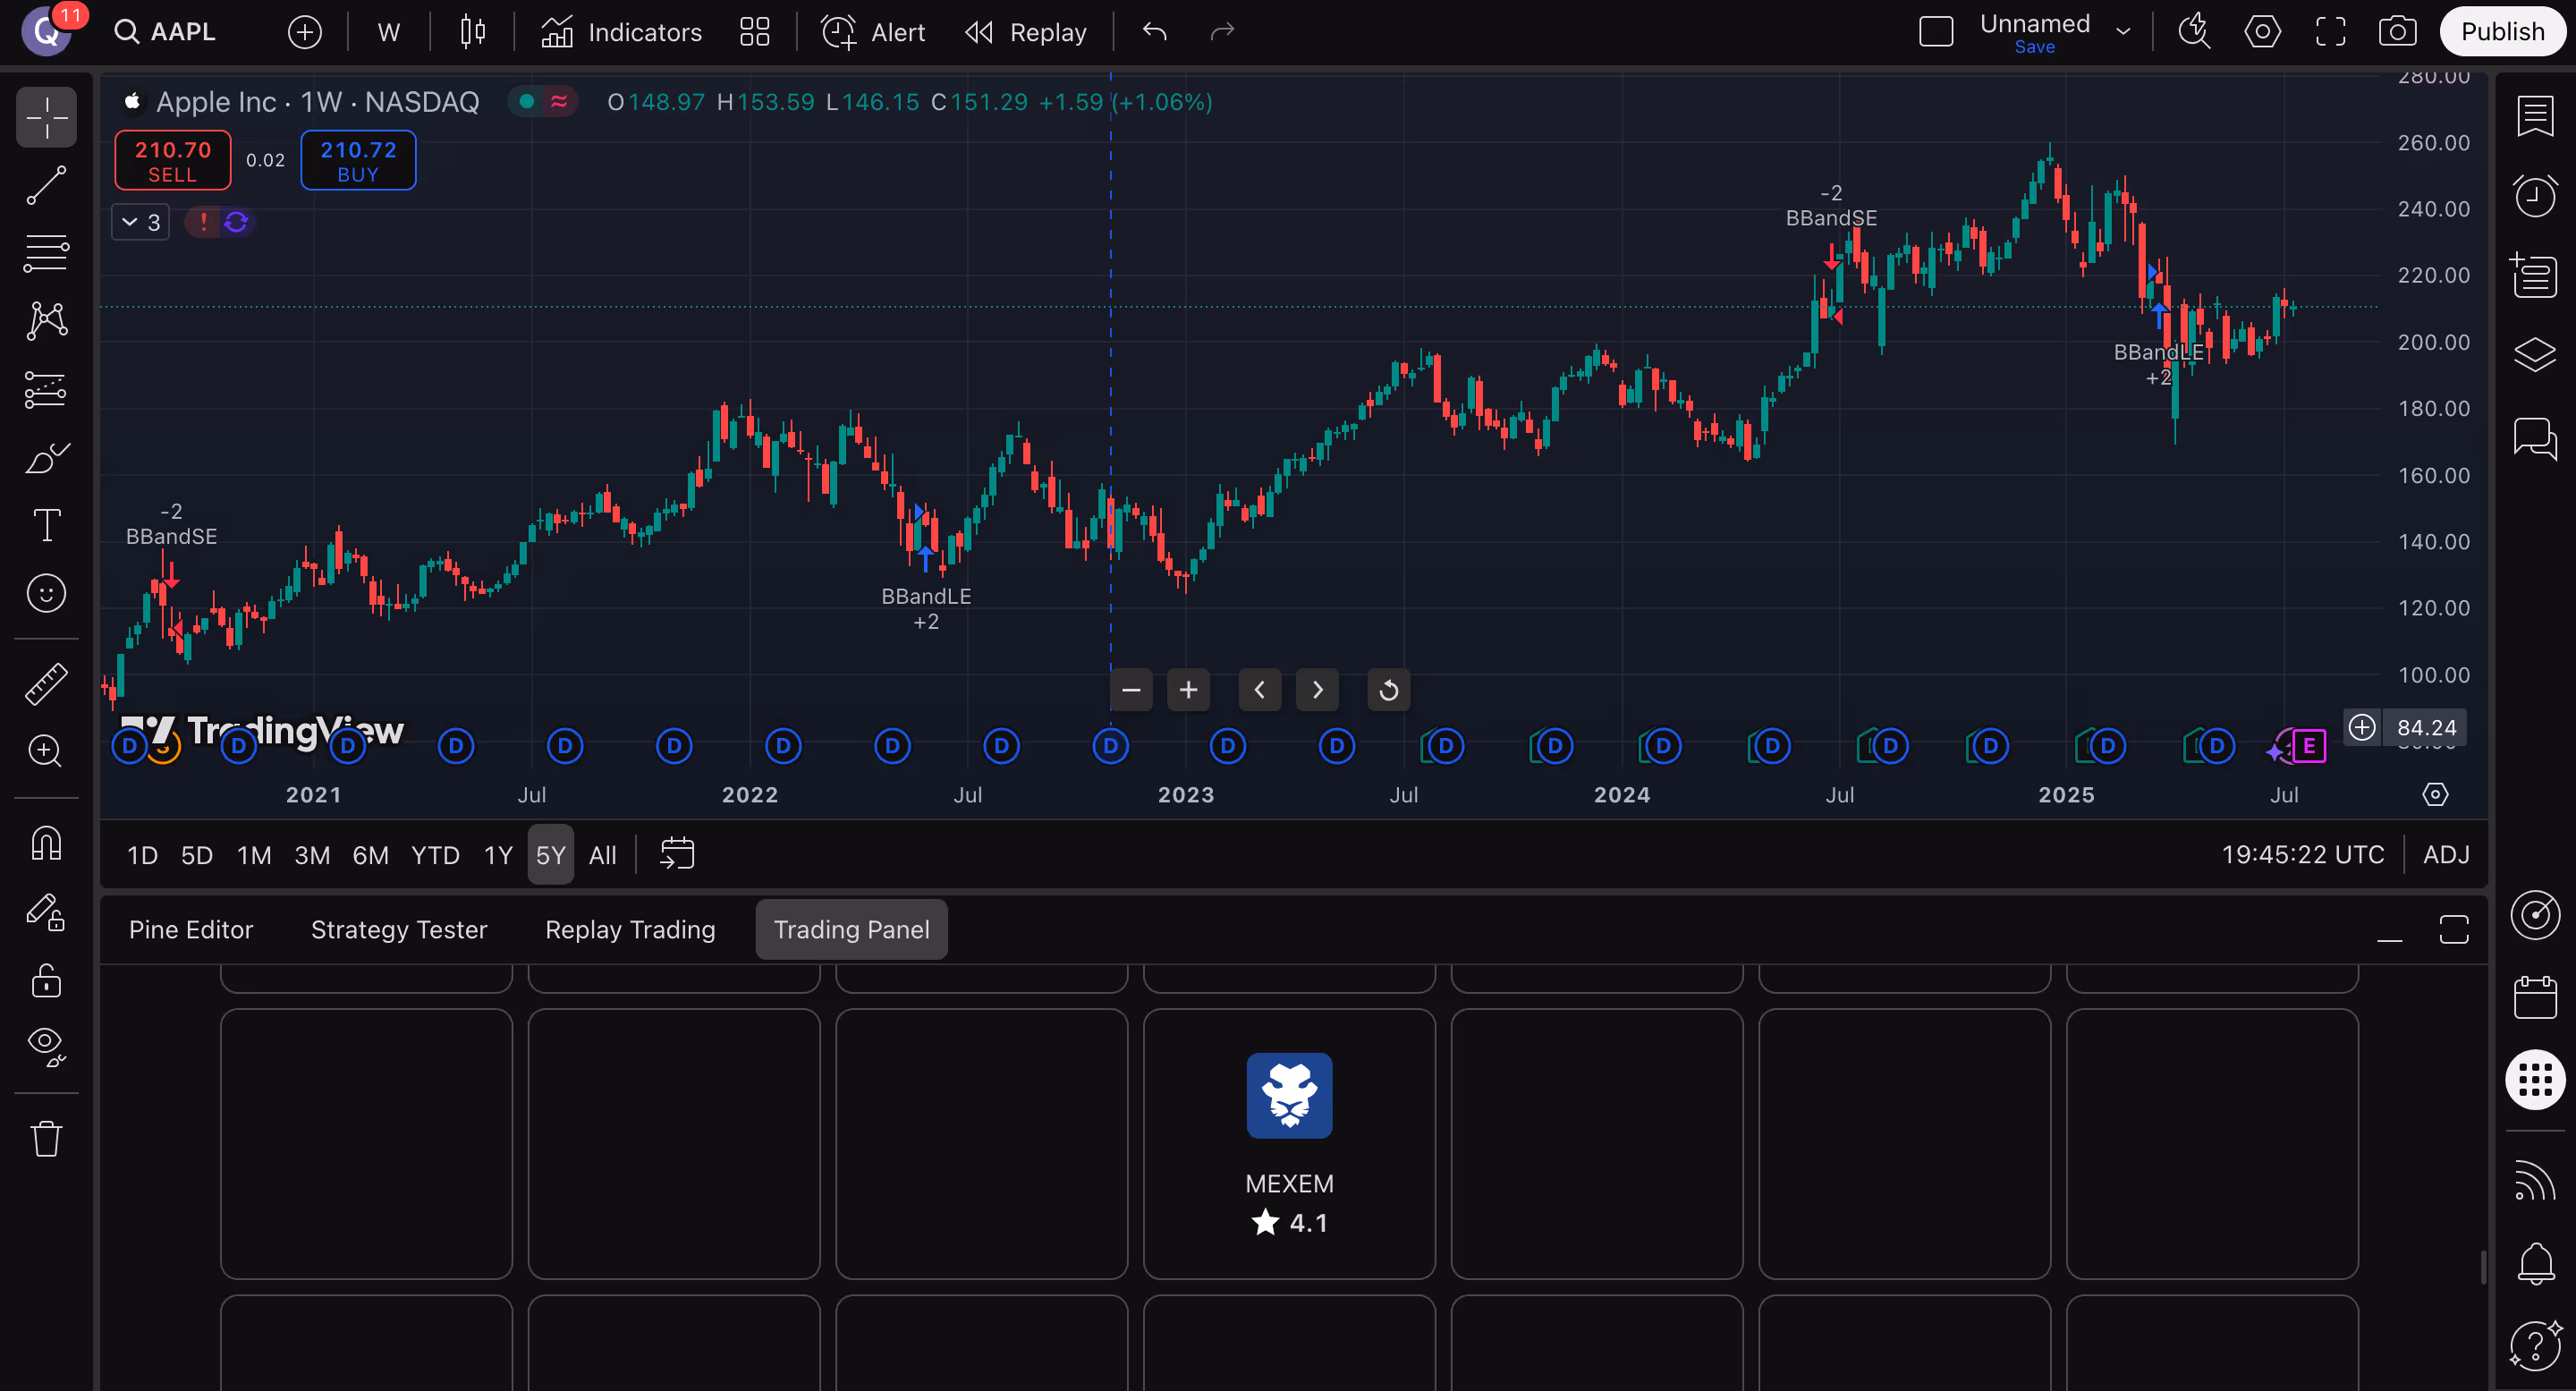
A connected trading experience powered by high-performance
charting technology


Combine MEXEM’s global market access with TradingView’s powerful
charts and analytical tools all in one connected trading setup.

Advanced Insight
Powers Trading

We’ve brought MEXEM and TradingView together to create a more connected trading experience. Benefit from MEXEM’s market access and competitive pricing alongside TradingView’s advanced charts, screeners and analytical tools.

TradingView advantages

Intuitive interface

Move seamlessly from one chart analysis to trade placement through one connected interface.

Deeper market analysis

Explore dynamic charts and tools to analyze market opportunities with greater clarity.

Powerful trading

Access TradingView’s charts, indicators, screeners and alerts while staying connected to your MEXEM account.

Why trade with MEXEM?

Low fees
Invest in EU & US stocks starting from as low as €1/$1 per trade
Global market access
Unlock access to 170+ global markets & explore opportunities across stocks, ETFs, options, futures, warrants & bonds and more.
Multilingual support
Benefit from human support in your language
Low fees
Invest in EU & US stocks starting from as low as €1/$1 per trade
Global market access
Unlock access to 170+ global markets & explore opportunities across stocks, ETFs, options, futures, warrants & bonds and more.
Multilingual support
Benefit from human support in your language

Fee Structure & Transparency

Investment Amount € 20,000
Annual Fee (1%) € 200
Est. Total Cost Range* € 260 - € 360
5 K
€ 20,000
1 M

*Range includes 1% fee and rebalancing transaction costs (0.3% - 0.8%)

How to connect MEXEM to TradingView

FASE 1

  • Create your MEXEM account.
  • Once activated and funded, go to the TradingView website.
TradingView candlestick chart of Apple Inc. stock from 2020 to 2025 showing price trends, buy and sell signals, and dividend dates.

FASE 2

  • Log in to your TradingView account and open Supercharts.
  • Click Trade in the top-right corner and select MEXEM as your broker
TradingView screen showing Apple Inc. stock chart with a MEXEM broker connection pop-up overlay.

STEP 3

  • Click connect to continue.
  • Login with your MEXEM account details and begin trading.
TradingView chart of S&P 500 Index daily candlesticks showing price fluctuations and volume from June to early August, with the index currently decreasing to 6,249.73.

FAQ

Trova le risposte che ti servono per iniziare a costruire il tuo portfolio oggi stesso.

How do I connect MEXEM to TradingView?

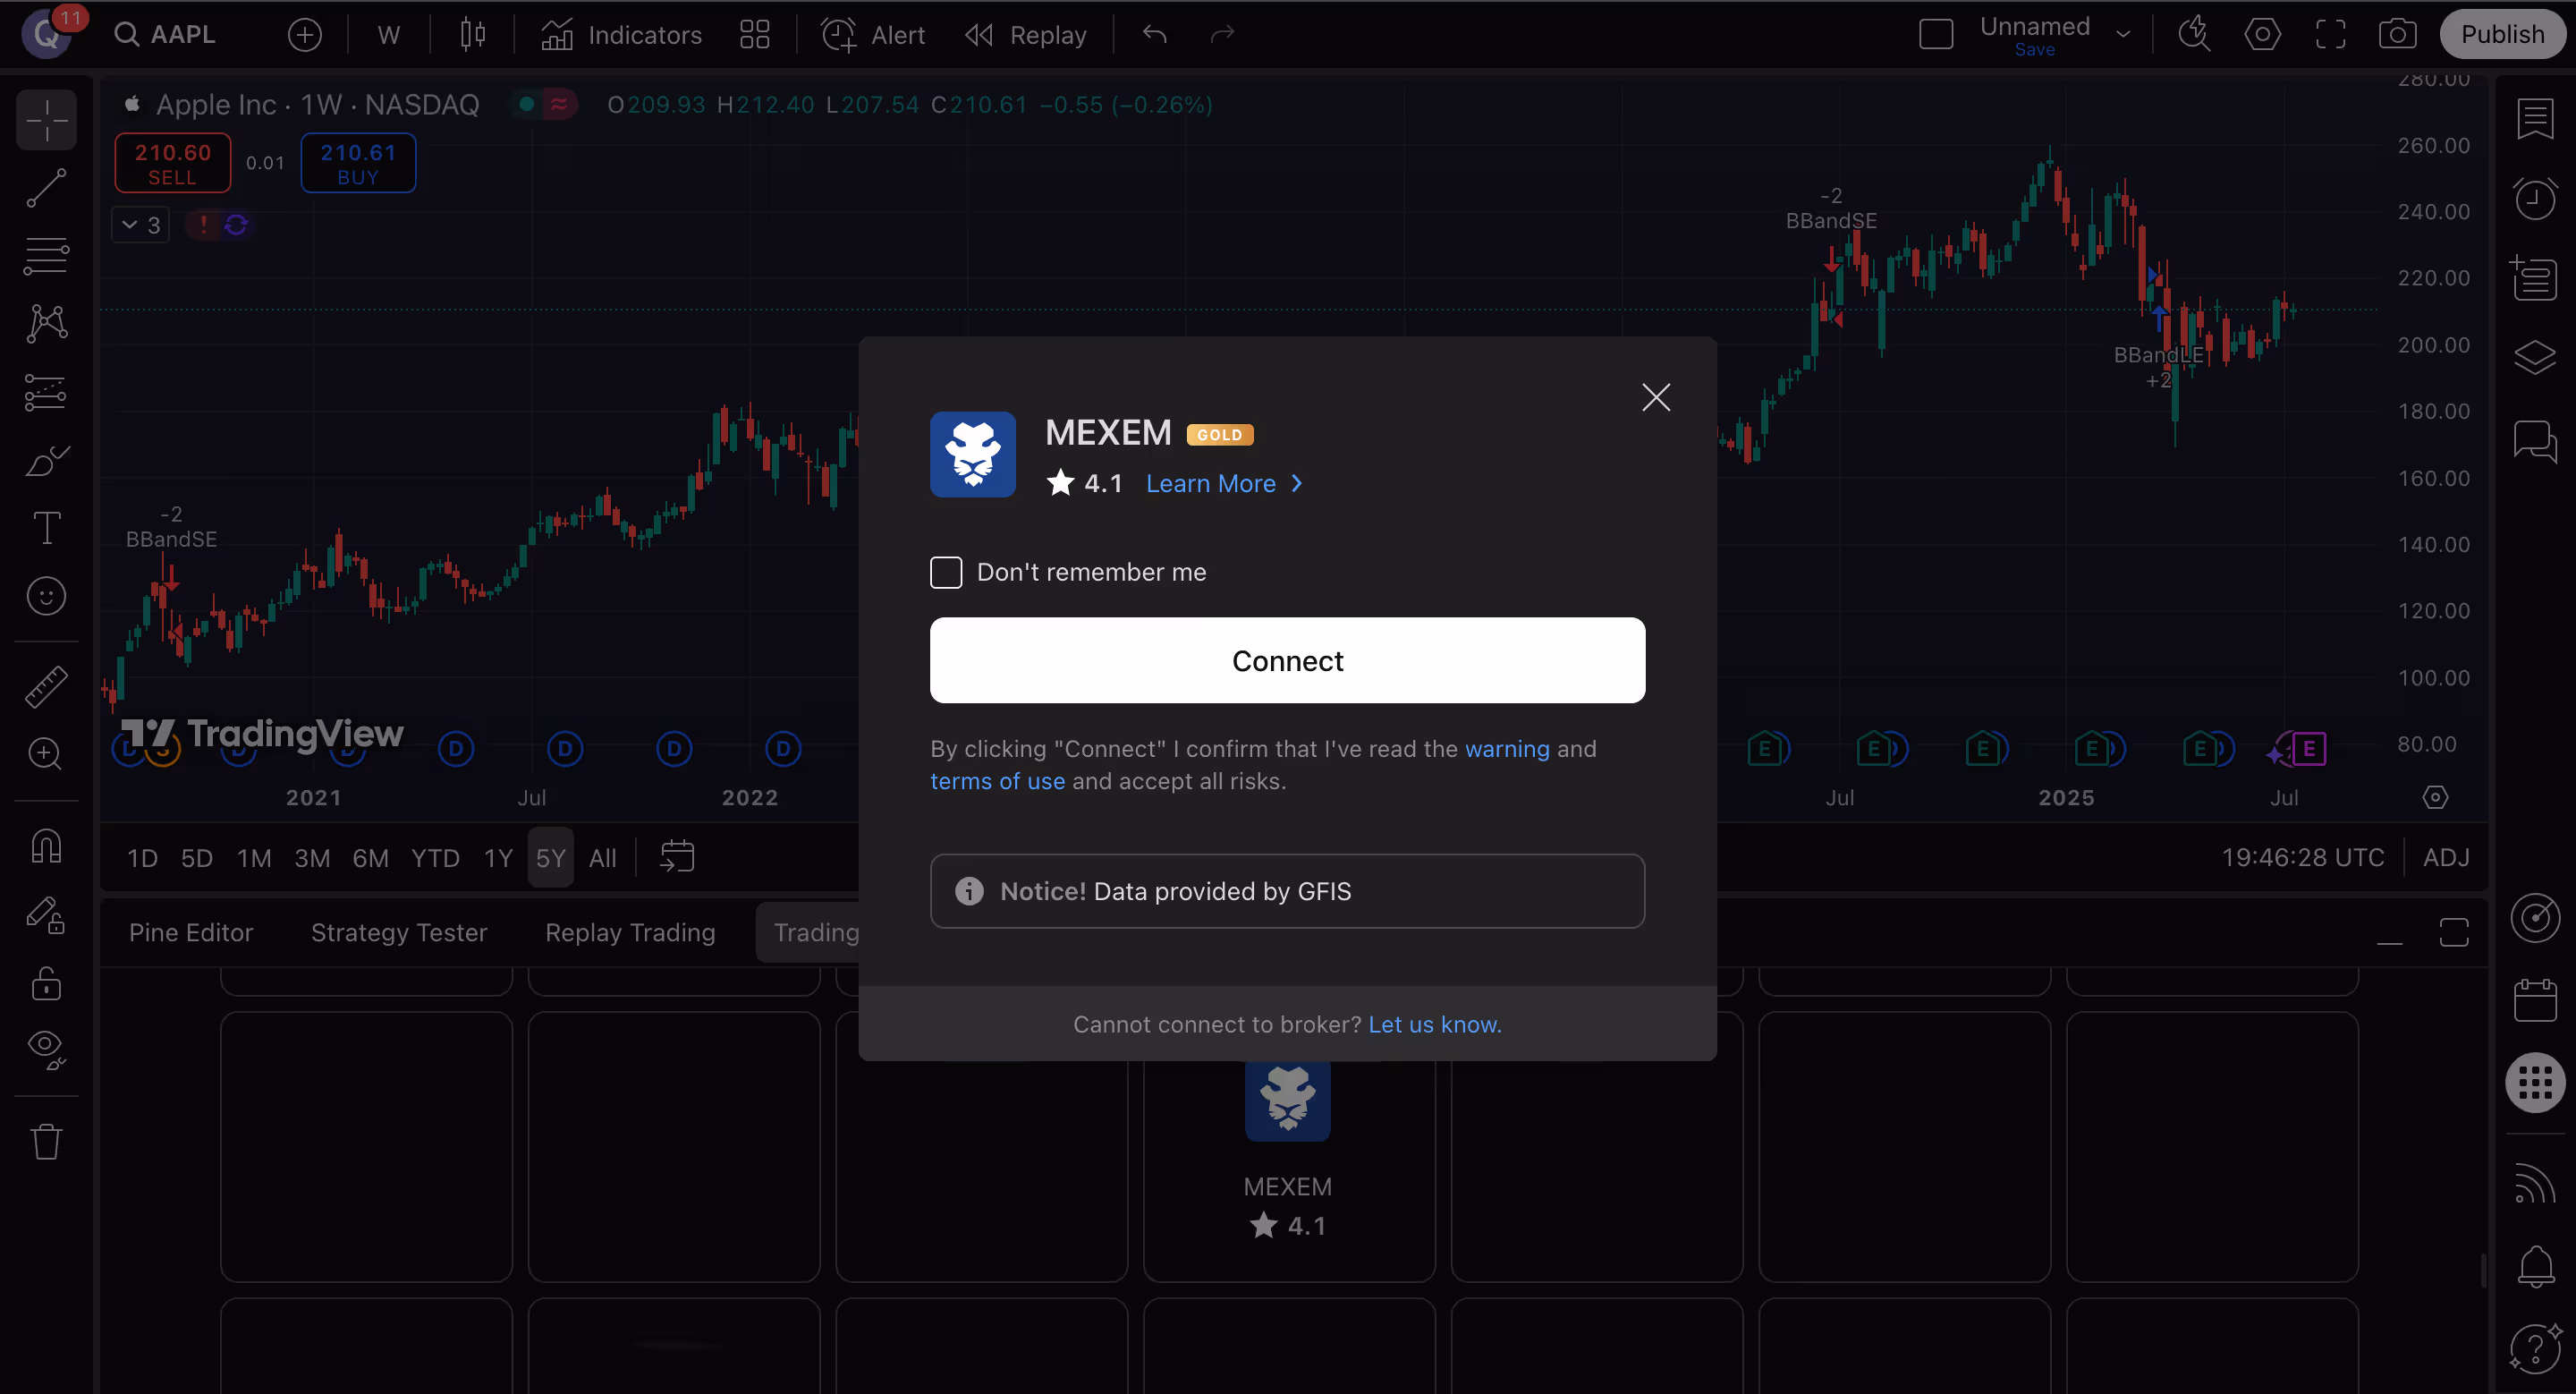
Open Supercharts, go to the Trading Panel, select MEXEM, and sign in with your MEXEM account credentials.

Do I need a MEXEM account to use the integration?

Yes. You need an active MEXEM account before connecting through TradingView.

Can I trade directly from TradingView?

Yes. Once connected, you can trade from TradingView’s Supercharts interface.

Which markets and products can I access?

MEXEM’s TradingView lists access to instruments including stocks, futures, bonds and ETFs, subject to account type and regulatory permissions.

Can I connect my broker account on mobile?

Yes. In the TradingView mobile app, users can connect their MEXEM account from the chart tab by opening More and selecting Connected Broker.

What order types are supported?

MEXEM provides access to market, limit, stop, and stop-limit orders, and its TradingView profile also notes support for bracket orders.

Who should I contact for help?

For platform-related help, visit TradingView Support. For account-related assistance, contact MEXEM support.

exit icon

Open your Asset Management account
by JUNE 30 2026

Enjoy a 50% discount on our
1% management fee

PAGA SOLO LO 0,5%

INIZIA ORA
APRI UN CONTO